Successful healthcare practices never depend just on continuous billing operations. They believe in hard work but their main focus is on watching the right numbers. The right Revenue Cycle KPIs or Key Performance Indicators can tell you where your revenue cycle is performing well and where it’s losing money. Instead of relying on assumptions, you can make the right decisions with real numbers.
But do you know about the most important revenue cycle KPIs you need to measure? If not then let’s understand the top revenue cycle KPIs and how tracking them can improve your financial performance.
What are Revenue Cycle KPIs?
Revenue Cycle KPIs are measurable performance metrics that help healthcare organizations evaluate the efficiency of their billing and collections processes. These metrics track everything from claim acceptance rates and denial percentages to payment speed and collection performance.
You can’t assess your billing health without monitoring the right indicators, just as you wouldn’t diagnose a patient without looking at their test results. These figures show you whether patients are truly paying what they owe, whether claims are being processed successfully, and whether denials are affecting your earnings.
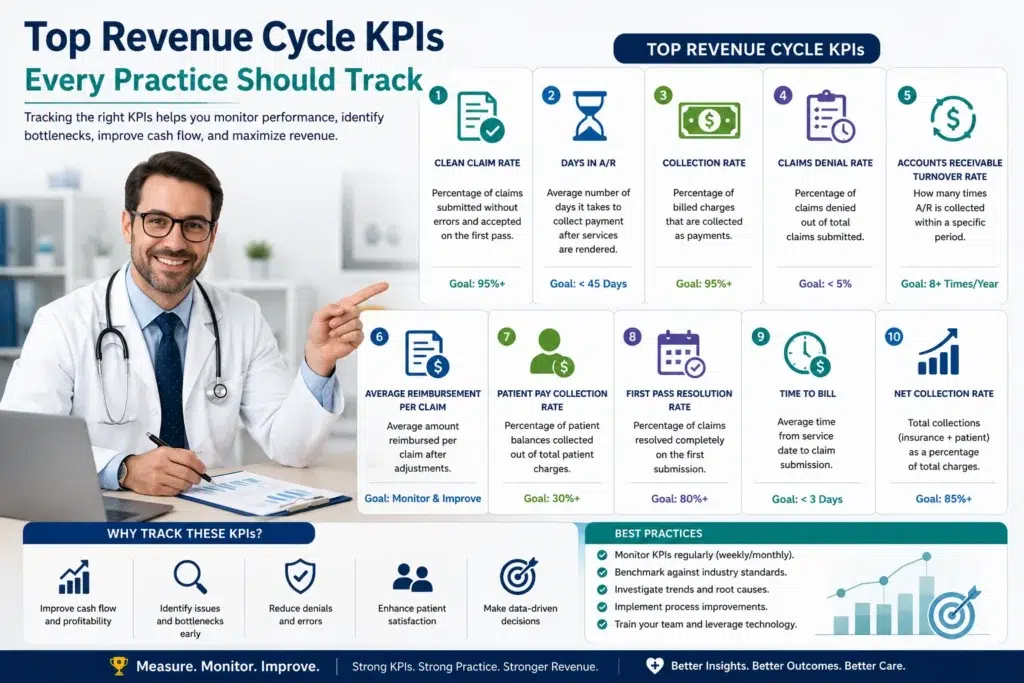
Now you don’t need to track 50 different data points to stay on top. Some useful KPIs give you clear insights into where your money is going and where you are missing. These revenue cycle management KPIs include:
- Clean Claim Rate
- Days in Accounts Receivable (A/R)
- First Pass Resolution Rate
- Claim Denial Rate
- Net Collection Rate
- Gross Collection Rate
- Bad Debt Rate
- Patient Collection Rate
- Average Reimbursement Per Encounter
- Cost to Collect
Timely monitoring of these KPIs helps all the practices to identify revenue leaks, improve collections, reduce denials, and strengthen overall financial health on time.
Top Healthcare KPIs to Monitor
Days in Accounts Receivable (Days in A/R)
Accounts receivable is the average number of days it takes your practice to collect payment after a service is rendered.
To calculate it:
Days in A/R = (Total A/R – Credit Balances) ÷ /(Total Gross Charges ÷ Number of Days in Period)
Under 30 days is excellent. Between 31 and 40 days is acceptable. Anything above 50 days is a warning sign you can’t ignore. Because days in A/R matter, the longer it goes, the more you lose. Aging A/R creates three problems like slow claim submission, payer delays, and a breakdown in your follow-up process.
That’s why each practice first looks at this KPI, as it gives you an instant view of how quickly money is actually flowing in.
Claims that remain in the 90+ days are statistically much harder to collect. The older the claim, the lower your chances of seeing that money.
Net Collection Rate (NCR)
Net collection rate is the percentage of collectible revenue your practice is actually bringing in after payer adjustments and contractual write-offs.
How to calculate it:
NCR = (Payments Received ÷ Net Charges) × 100
Top-performing practices hit 95% or higher. The industry average is around 90–95%.
This is the single most important revenue cycle management KPI. It reduces the gross charges and tells you how much of what you’re legitimately owed is actually being collected.
If your NCR is below 95%, find out whether the problem is on the payer side (denials, slow payment, underpayment) or the patient side (unpaid balances, missed statements). Then fix them separately.
Claim Denial Rate
The percentage of submitted claims that get rejected by payers is the claim denial rate.
How to calculate it:
Denial Rate = (Number of Denied Claims ÷ Total Claims Submitted) × 100
Best-in-class is under 3%. Under 5% is good. Above 10% means your front-end processes need attention.
Remember that denial rates have been increasing steadily and are still trending upward. About half of all denials come from front-end mistakes like eligibility issues, missing authorizations, and demographic errors. These are entirely preventable.
About 67% of denied claims are actually eligible for appeal but many practices never bother. That means missing revenue.
To start keeping denial rate updates, first arrange your denial data by payer and by reason code. You’ll almost always find a pattern, and maybe it’s one specific payer that’s consistently problematic, or one code that keeps triggering rejections. Fix the pattern, not just the individual claim.
Clean Claim Rate (CCR)
Clean claim rate shows the percentage of claims submitted that pass through payer edits on the first try without needing any corrections or additional information.
How to calculate it:
CCR = (Clean Claims Submitted ÷ Total Claims Submitted) × 100
95% or higher is the target. Most high-performing practices can make it up to 98%.
If your denial rate is the damage report, your clean claim rate is the prevention score. Every claim that goes out with an error is a claim that’s going to bounce back, remain in a queue, and cost your billing staff time to rework.
A low clean claim rate usually means there are small issues like incomplete documentation at the point of care, coding errors, or gaps in eligibility verification. Companies also invest in claim scrubbing software that helps to find errors before submission pays for itself quickly.
First-Pass Resolution Rate (FPRR)
The percentage of claims paid in full on the very first submission.
How to calculate it:
FPRR = (Claims Paid on First Submission ÷ Total Claims Submitted) × 100
Try to make it 90% or higher.
This KPI is closely related to the clean claim rate but it takes things a step further, it measures whether the claim not only got through the payer’s system but actually resulted in payment. A claim can be clean and still get denied for medical necessity or prior authorization issues.
A strong first-pass rate means your billing, coding, and clinical documentation are all working together.
Patient Collection Rate
The percentage of patient-responsible balances your practice successfully collects.
According to some statistics, patient collection rates in the business are as low as 34-48% which is a huge reduction.
This indicator deserves special attention right now because the medical billing landscape has changed over the past few years. High-deductible health plans have transferred a much larger share of costs to patients. That means even when your insurance billing is running perfectly, you could still be leaving huge revenue uncollected because the patient-facing side of your process isn’t keeping up.
The best things to do are:
Giving patients cost estimates before their visit, offering multiple payment options, and following up consistently on balances. Practices that combine financial counseling with convenient online payment tools consistently outperform those that rely on paper statements alone.
Cost to Collect
How much does it cost your practice, including staff time, technology, and administrative overhead, to collect every dollar of revenue.
How to calculate it:
Cost to Collect = (Total Revenue Cycle Costs ÷ Total Collections) × 100
It shows in percentage and some of the best practices keep it between 3–7% of net revenue collected.
This is a KPI that often gets overlooked until a practice becomes limited operationally. If you’re spending a lot of staff hours appealing denials, resubmitting claims, and manually following up on patient balances, your cost to collect is low, even if your revenue looks fine on paper. Automation is the best solution to reduce per-claim administrative costs.
Bad Debt Rate
The percentage of accounts receivable that ultimately gets written off as uncollectible.
How to calculate it:
Bad Debt Rate = (Total Write-Offs ÷ Total A/R) × 100
Keep it as low as possible. A persistent increasing trend should be taken seriously.
Bad debt is money your practice earned but will never see. Some of it is unavoidable but a high or increasing bad debt rate always indicates problems with patient eligibility verification, financial counseling, or collection follow-up. The fix usually starts before the patient even visits the practice.
Authorization and Eligibility Approval Rate
The percentage of prior authorizations that are successfully obtained before services are rendered.
Eligibility issues alone account for roughly 22% of preventable denials. Practices that verify coverage thoroughly before every visit catch problems before they become claim denials, which means fewer headaches and faster payment.
If your authorization approval rate is lagging, look at whether your front desk team has the tools and training to find coverage issues upfront. Automating eligibility checks through your EHR or practice management system is one of the highest-ROI investments a practice can make.
Charge Capture Rate
The percentage of services rendered that are actually being documented and billed.
Try to keep it as close to 100% as possible.
Only 32% of healthcare providers capture charges within the first 24 hours of a patient encounter, which means the majority are creating unnecessary delays and risk. Every charge that gets missed is revenue you legitimately earned but will never collect.
This KPI reveals workflow gaps between the clinical and billing sides of the house. Providers who see a patient but don’t document the encounter in a way that feeds into billing are essentially working for free on those visits.
Additional Revenue Cycle Management KPIs
All the KPIs described above are essential but many successful healthcare organizations also track:
- Charge Lag Days
- Claim Submission Rate
- Insurance Verification Accuracy
- Payment Posting Turnaround Time
- Appeal Success Rate
- Patient No-Show Rate
- Days in Billing Hold
- Credit Balance Rate
- Underpayment Recovery Rate
Improve Your Revenue Cycle with M&M Claims Care
Keeping check and balance in every field is necessary to grow. Tracking KPIs is the first step but turning those numbers into better financial results takes experience, accurate billing processes, and ongoing optimization.
At M&M Claims Care, our revenue cycle management experts help healthcare practices reduce claim denials, accelerate reimbursements, improve collections, and maximize profitability through proven billing strategies and performance-driven reporting.
If you want to strengthen your revenue cycle, just contact M&M Claims Care today for a free consultation at: +1 (267) 768-7915.